
- Home
- Golden Math
- Flower of Life
- Sacred Solids
- And much more...
- 3D Models
- 3D Flower of Life
- 3D Platonic Solids
- 3D Archimedean Solids
- 3D Catalan Solids
- 3D Deltoidal Hexecontahedron
- 3D Deltoidal Icositetrahedron
- 3D Disdyakis Dodecahedron
- 3D Disdyakis Triacontahedron
- 3D Pentagonal Hexecontahedron
- 3D Pentagonal Icositetrahedron
- 3D Pentakis Dodecahedron
- 3D Rhombic Dodecahedron
- 3D Rhombic Triacontahedron
- 3D Tetrakis Hexahedron
- 3D Triakis Icosahedron
- 3D Triakis Octahedron
- 3D Triakis Tetrahedron
- 3D Pyramids and Prisms
- 3D Stellations
- Phi in ...
- Sacred Solids in ...
- Music and Geometry
- About
- 3D Models
- Sacred Geometry and Energy
Phi and Music in DNA
1. Introduction
As it often happens in research, the results shown in this article were found "accidentally", while I was trying to reproduce Jean-Claude Perez’s results on the cumulated populations of DNA codons [1]. This researcher has been studying for many years the populations of codons from the whole human genome (not just the 2% coding DNA). When calculating the ratios of these populations cumulated in different ways, he obtained the Golden Ratio related attractor (3-φ)/2. With a similar methodology, I have found the following two astonishing results:
- The relative populations of several groups of eight codons in the whole human DNA correspond to the ratios of musical notes.
- The relative populations of some specific groups of eight codons in the whole human DNA is exactly the Golden ratio φ.
2.- DNA Basics
Our genetic information is coded in the DNA in the form of texts formed by “words” that are 3 “letters” long. These words are called codons. Each letter in a codon comes from 4 possible nitrogenized bases: A (adenine), C (cytosine), G (guanine) and T (thymine). The coding system is similar in all living organisms and is called the Genetic Code. There are 43=64 possible combinations (words) of these 4 bases (groups of 3 with possible repetitions). They are usually arranged according to the 4 columns of the well-known Universal Genetic Code map (column T, then column C, then column A, then column G) (Table 1).
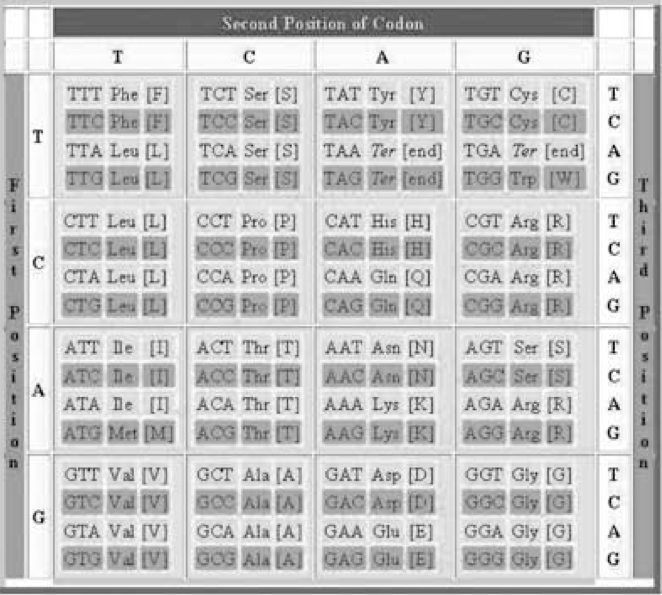 |
| Table 1: The 64 codons of the DNA arranged as the Universal Genetic Code map. Each codon codifies one amino acid (reproduced from [3]). |
The 64 codons codify the 22 known amino acids, 20 of which are found in humans. Therefore, some amino acids are simultaneously coded by several codons (see Table 1). This fact is known as the degeneracy of the code. The amino acids are the basic building blocks of proteins, the main components of any living organism.
All the known functions of the genetic control of an organism are located in approximately 2% of the DNA, the so-called coding DNA. The remaining 98% is called “junk DNA” because supposedly it does not code anything. The research presented here has been performed using the whole DNA.
The famous double helix of the DNA molecule has two related strands that contain a sequence of nitrogenized bases. These strands are complimentary: in front of an A (or G) base in a strand, there is always a T (or C) base in the opposite strand.
3.- Methodology
In his work Jean-Claude Perez analysed the entirety of the whole human genome (not just the coding 2%) from the 2003 “BUILD34” finalized release [2]. He considered only a single strand of the DNA sequence. Given a sequence of bases, for example TCAATGTCA, if the starting point is unknown there are three possible ways of grouping the bases into codons; these three codon groupings are known as the codon reading frames:
1) TCA|ATG|TCA
2) CAA|TGT|CAT
3) AAT|GTC|ATC
Using one whole DNA strand, Jean-Claude Perez computed, for each of the 3 possible codon reading frames, the cumulative number of each of the 64 genetic code codons. In his book "Codex Biogenesis" [3] he also provides the cumulative populations of codons obtained joining the 12 possible reading combinations (2 strands x 2 senses per strand x 3 reading frames). My results were obtained while trying to replicate his results on this bigger population table (Table 2).
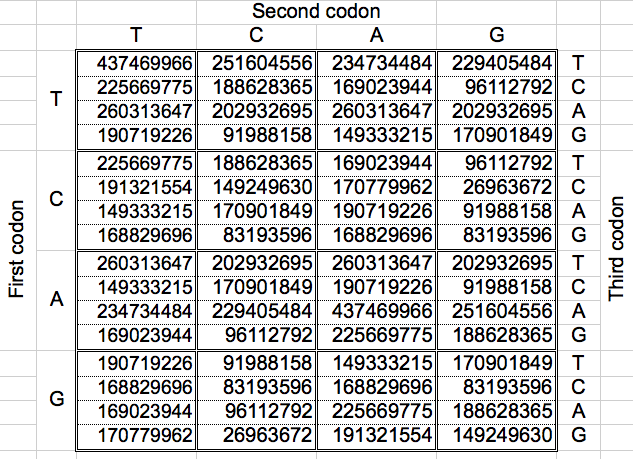 |
| Table 2: The cumulated populations of the 12 possible reading combinations of the 64 codons of the DNA, arranged as the Universal Genetic Code map (Total: 11373646448) [3]. |
From the preceding table, I first started by adding the codon populations in the groups suggested by Jean Claude Perez following the Dragon curve paper folding (Figure 1) [1]. This led me to replicate some of his results exposed in [1] (section 4). After that, I decided to investigate the ratios of cumulative codon populations of groups of 8 codons. This operation can be done horizontally or vertically, but the final results were almost the same (Section 5). I was searching for similar Golden Ratio related attractors, and I found them after computing the ratios of the cumulated codon populations of some specific groups of eight codons joined alternatively (Section 6).
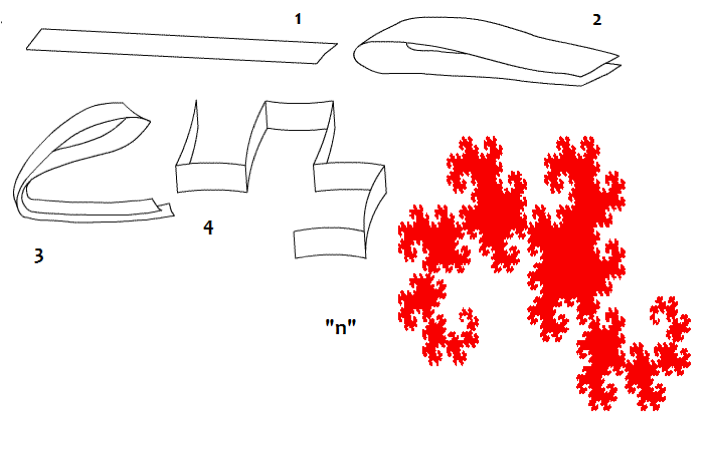 |
| Figure 1: Dragon curve paper folding. |
4.- Replication of Jean-Claude Perez's results
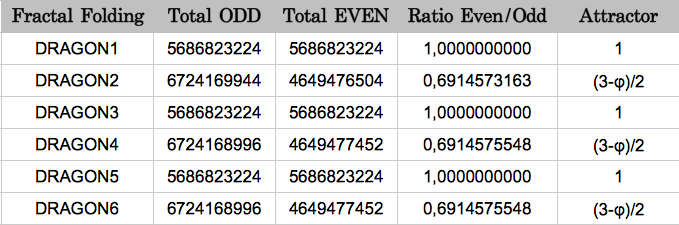
The Dragon curve involves a folding mechanism very common in the Poincare theory of chaos (Figure 1). According to it, the codon population matrix presented in Table 2 was partitioned six times according to the six first partitions of the Dragon curve:
Dragon 1: 2 partitions of 32 codons each
Dragon 2: 4 partitions of 16 codons each
Dragon 3: 8 partitions of 8 codons each
Dragon 4: 16 partitions of 4 codons each
Dragon 5: 32 partitions of 2 codons each
Dragon 6: 64 partitions of 1 codon each
The following figure shows graphically those foldings or partitions. For each folding, the total numer of codons in the purple region was divided by the total number of codons in the blue region. The result were the two values previously reported by Jean Claude Perez: ratio purple/blue=1 in Dragons 1, 3 and 5. And ratio purple/blue=(3-φ)2 in dragons 2, 4 and 6. The first attractor 1 corresponds to the ratios of bands A or G over bands T or C, whereas the attractor (3-φ)/2 corresponds to the ratios of bands C or G over bands T or A.
| DRAGON 1 | DRAGON 3 | DRAGON 5 |
 |
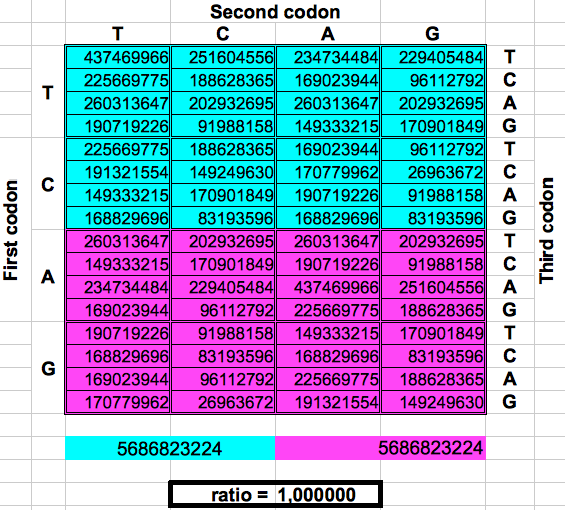 |
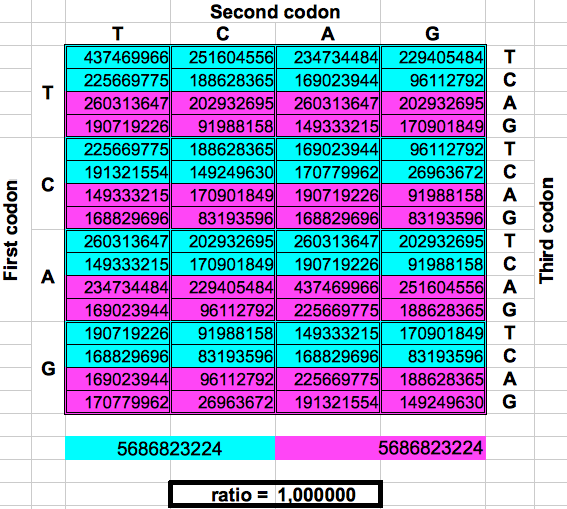 |
| DRAGON 2 | DRAGON 4 | DRAGON 6 |
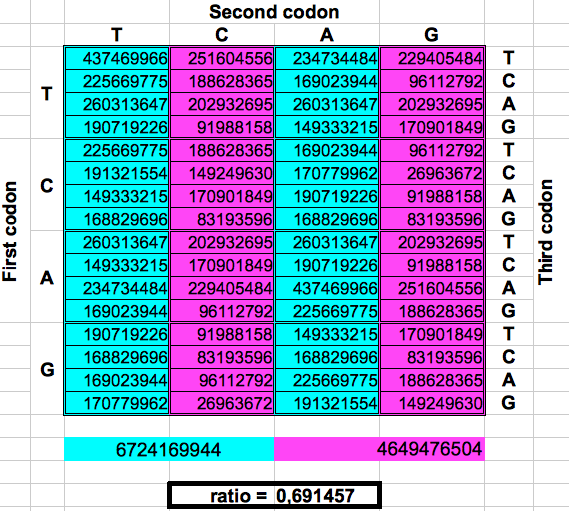 |
 |
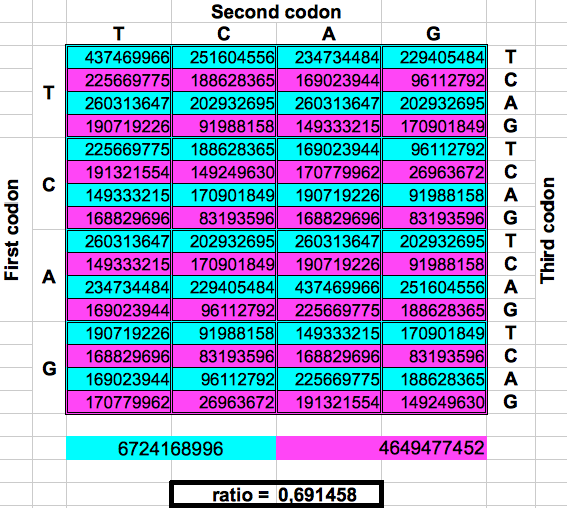 |
| Figure 2: Dragon curve paper folding applied to the population of codons in the whole human genome. | ||
My results are summarized in Table 3. The error between the experimental and the theoretical value of the attractor (3-φ)/2 is only 0.069%. This shows that the results obtained by Jean Claude Perez using the three reading frames and a single DNA strand, are still valid using a larger population consisting of the 12 possible combinations of reading frames, reading senses and two strands.
 |
| Table 3 |
5.- Musical notes in the DNA
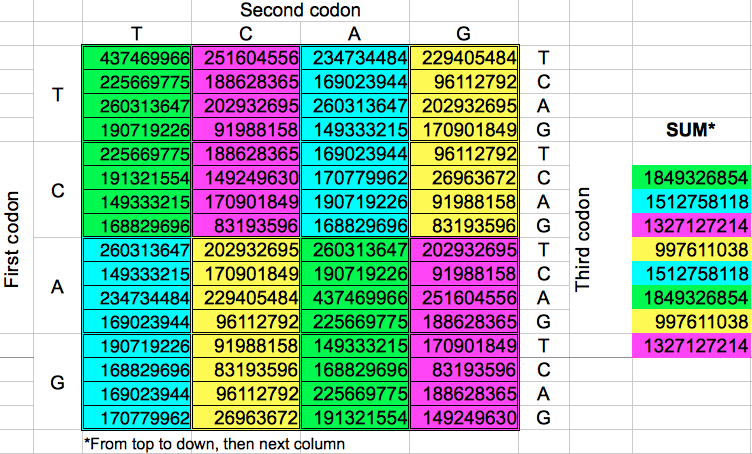
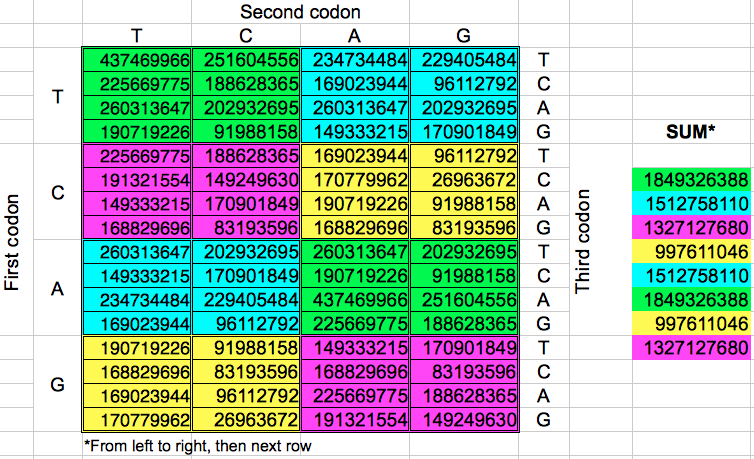
Starting from the codon populations in Table 2, I added the codon populations in groups of 8 consecutive codons. Despite the fact that there are eight such groups of codons, I obtained only four different values for the cumulated population (Table 4). When this operation was replicated in the opposite direction, the final results were almost the same: four cumulative values very similar to the preceding ones. A more detailed examination of each gorup of eight codons of the same color reveals that the corresponding codons in each group have the same populations but with a different ordering.
 |
 |
|
| Table 4: Cumulative population of groups of eight consecutive codons grouped horizontally or vertically. | ||
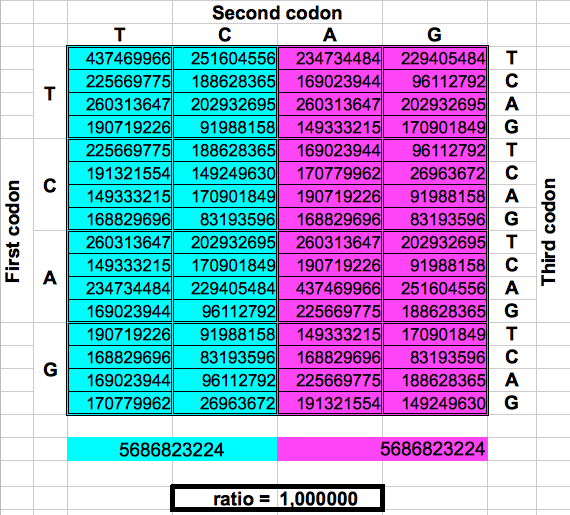
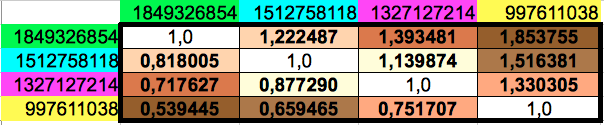
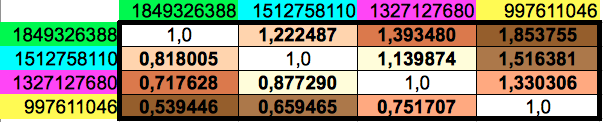
Then I computed the ratios between any pair of the four different cumulated codon populations, which leads to the matrix shown in Table 5. Observe that the lower diagonal of this matrix contains the inverse values of the upper diagonal ones. The results for the horizontal and vertical ordering of codons only differ in the 6th decimal place of four out of twelve non-diagonal values.
 |
 |
|
| (a) | (b) | |
| Table 5: Ratios of every pair of cumulated populations of the groups of 8 consecutive codons. Please note that the lower diagonal of this matrix contains the inverse values of the ones in the upper diagonal. | ||
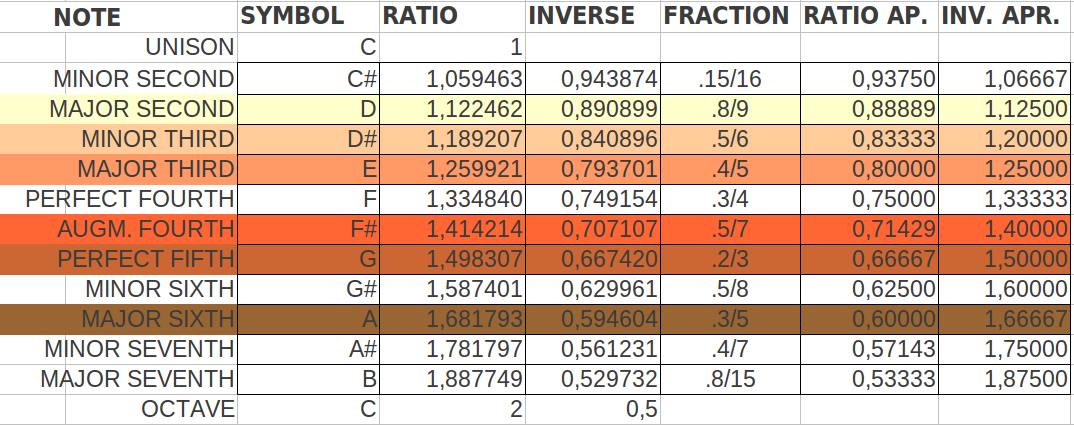
With my calculations, I was trying find some relationship of the ratios of these reduced groups of codon populations to the Golden Ratio. Instead, what I found is that the resulting ratios were very close to the ratios of the musical notes in an octave. For the reader without musical knowledge like me, I reproduce in Table 6 the twelve different notes in an octave following the so-called Equal Temperament scale. This consists on dividing the octave into 12 equally spaced values in the logarithmic domain. This translates to the 12th root of 12 consecutive powers of 2 in the linear domain. Each value has a corresponding fractional approximation that is also shown in the table.
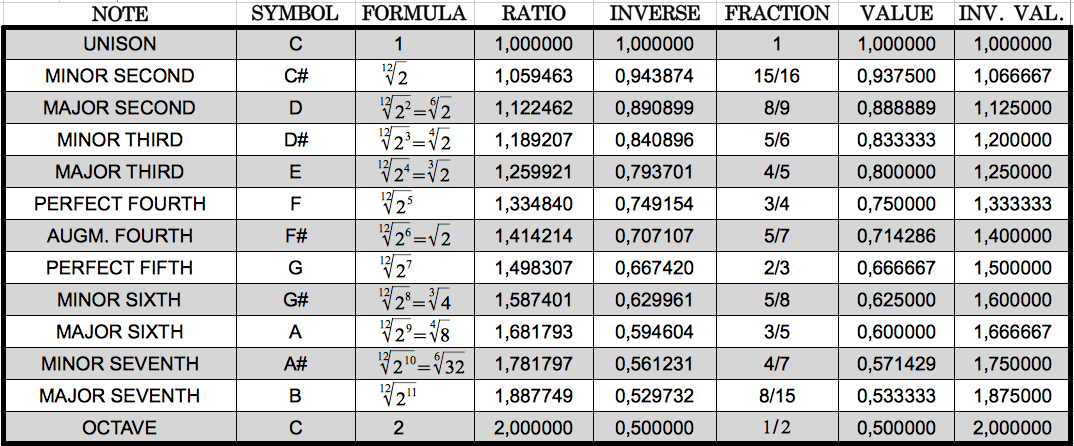 |
| Table 6: The equal temperament musical scale in an octave. |
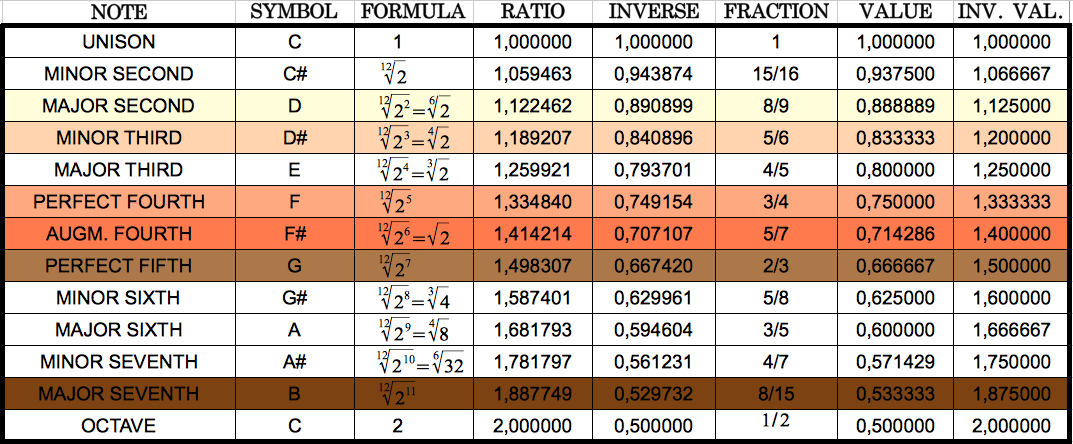
Table 6 allowed me to notice that the ratios that I had obtained correspond very closely to musical notes. I highlight them in colours in the following table, using the same colours that in Table 5 above for ease of comparison.
 |
|
Table 7: The six musical notes that closely match the six different codon population ratios shown in Table 5. Each ratio and the corresponding note share the same colour. |
In the next table I show the absolute and relative error computed between each codon population ratio and the corresponding musical note. We can see that the error is always below 2.8% (0.033), with an average value of 1,53% (0.021). In other words, the average accuracy is 98.47%!!
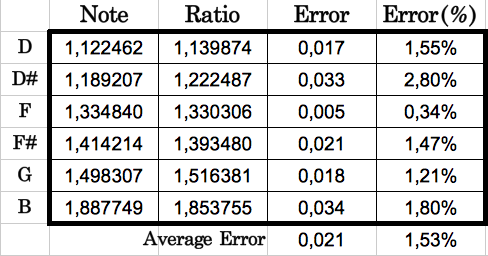 |
| Table 8: Comparison of each codon population ratio with its corresponding musical note. The average error is as low as 1.53% |
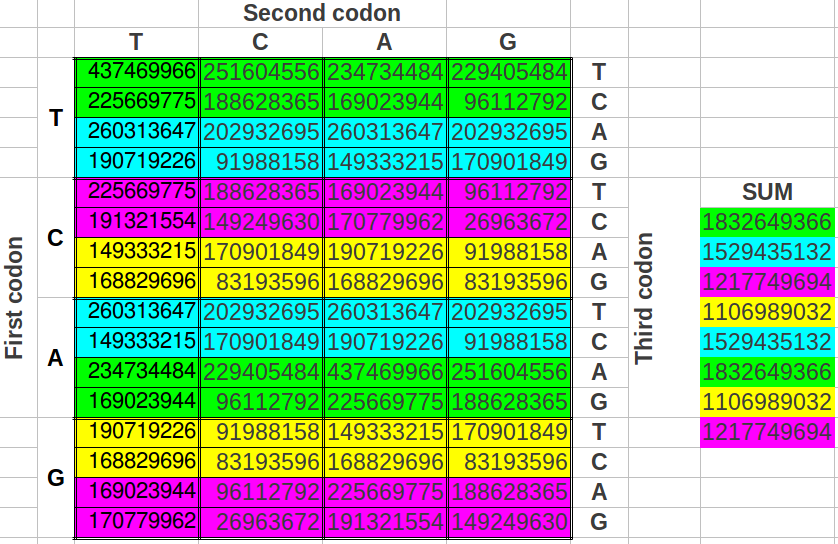
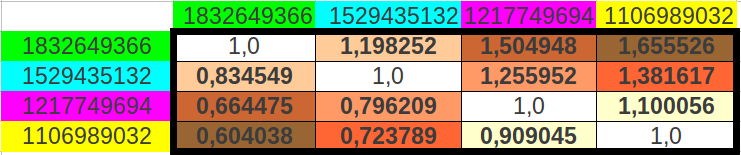
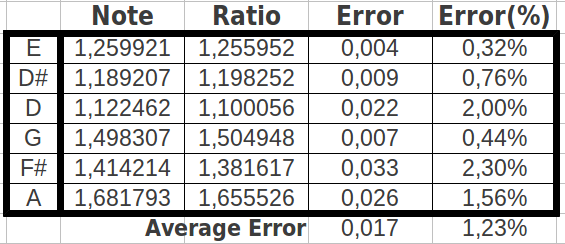
The reader who is familiar with the universal genetic code map will surely find unusual the way we have chosen to select eight consecutive codons. That is so because codons are usually numbered consecutively in the horizontal direction, and then one jumps to the next row. What would be the result if we grouped the codons following this more "natural" way? As we could expect, the codon populations also sum up to four different values (Table 9a) and the possible ratios between the cumulative values closely resemble musical notes too (Table 9b) with an error even lower than in the two preceding ordering methods (0.017 or 1.23%, accuracy 98.77%, Table 9c). The results are also six different musical notes, but they are different than in the preceding cases (Table 10).
 |
 |
|
| (b) | ||
 |
||
| (a) | (c) | |
| Table 9: Results obtained when cumulating the groups of eight codons followin the "natural" order in the universal genetic code map. | ||
 |
| Table 10: The six musical notes that more closely match the six different codon population ratios shown in Table 9. The resulting notes are different than in the two preceding ordering methods. |
6.- The Golden Ratio comes back
There are many ways in which one can make groups of eight codons in the table of the universal code map. The following question that came to my mind was: what would be the result if we took the groups of eight codons as alternating pairs of four? For my surprise, the cumulative values of such groups of eight codons were reduced to three instead of four different values (Table 11).
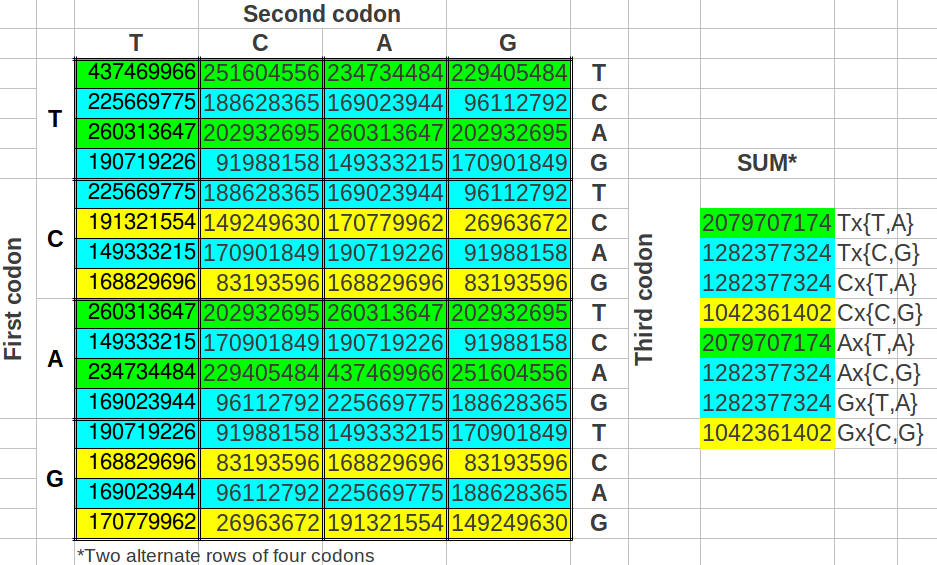 |
| Table 11: Cumulative population of groups of eight codons grouped in alternated rows. |
And when I computed the possible ratios between those cumulative values, the result was astonishing: one of the resulting values was the Golden Ratio itself (φ), the other was an exact octave ratio (2), and the third one was the quotient of them (2/φ) (Table 12a). The error between the exact values and the experimental ones was as low as 0.31% (Table 12b).
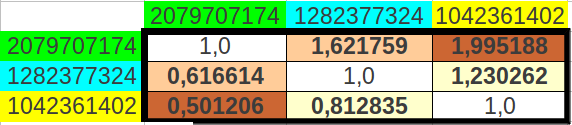 |
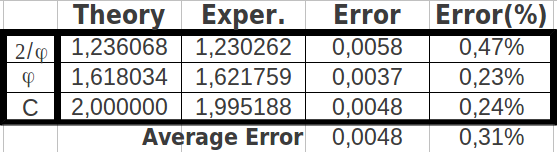 |
|
| (a) | (b) | |
| Table 12: The ratios of cumulated populations of groups of eight codons taken alternatively correspond to the Golden Ratio, to a perfect octave, and to the quotient between both. | ||
7.- Discussion
In this article, we have been able to confirm that the Golden Ratio related results obtained by Jean-Calude Perez on codon populations of single-stranded DNA are still valid when considering the codon populations of the double-stranded DNA and both senses of lecture. The Dragon curve folding mechanism provides three ways of partitioning the codons of the whole human genome in two halfs of exactly the same population (proportion=1); this highlights the symmetry and redundacy inherent in the human genetic code. But the Dragon curve folding also provides three ways to divide the same whole human genome codons in two halfs whoe populations are in a proportion related to the Golden Ratio, namely (3-φ)/2. This shows that, at a global scale, the Golden Ratio harmonizes the overall codon population. Note that this harmony is valid for the whole human genome, not just for the 2% known as coding DNA.
When one descends to a smaller scale, namely taking groups of eigth codons instead, musics comes into play. In this case, we have found at least three ways of selecting groups of eight codons such that the ratios among their populations are related according to musical notes. The sequence of notes depends on the way the groups are selected. The similarity to musical notes has an average accuracy of 98.77%. Therefore, what we are led to conclude is that the whole human genome appears to be organized according to musical theory, at least at the scale of groups of eight codons. Is that feasible from a natural evolution perspective? It's difficult to believe. Does God play music? It could be. The great research by Scottish composer Stuart Mitchell and peers has revealed that DNA is a cosmic musical score operating triplets of rhythm at over 3000 beats minute [4]. The researcher Susumu Ohno [3] has shown that DNA coding base sequences can be transformed into musical scores and conversely. Ohno says: "The principle of repetitious recurrence pervades every aspect of life on this earth. Thus, individual genes in the genome have been duplicated and triplicated often to the point of redundancy [...] This principle even appears to govern the manifestations of human intellect; musical compositions also rely on this principle of repetitious recurrence. Accordingly, coding base sequences can be transformed into musical scores using one set rule. Conversely, musical scores can be transcribed to coding base sequences of long open reading frames".
Finally, we have discovered that when the groups of eight codons are selected in a very specific way, the musical notes converge to just three resonant values: an octave (2), the Golden Ratio itself (φ) and the relation of both (2/φ). This clearly shows that the Golden Ratio is operating not only at a global scale (1/2) as shown by Jean-Claude Perez, but also at much lower scales (1/8). Codon populations of the DNA at many scales seem to be governed both by Music and by the Golden Ratio. Pythagoras said: "There is geometry in the humming of the strings, there is music in the spacing of the spheres"
It could be argued that our results are partially due to the symmetry inherent to the double-stranded DNA. Jean-Claude Perez himself already showed that in a single-stranded DNA the Golden Ratio is at work at the scale 1/2. I have verified, although the results are not shown here, that the similarity to musical notes and the sacred key φ at scale 1/8 still appear in the single-stranded whole human DNA analized by Jean-Claude Perez. Anyone interested can replicate these investigation or take them one step further with the data provided in references [1-3].
8.- References
[1] Perez, Jean-Claude, "Codon Populations in Single-stranded Whole Human Genome DNA Are Fractal and Fine-tuned by the Golden Ratio 1.618", Interdiscip Sci Comput Life Sci (2010) 2: 228–240.
[2] http://hgdownload.cse.ucsc.edu/goldenPath/hg16/chromosomes/
[3] Perez, Jean-Claude, "Codex Biogenesis",
[4] Ohno, Susumu; Ohno, Midori: "The All Pervasive Principle of Repetitious Recurrence Governs Not Only Coding Sequence Construction But Also Human Endeavor in Musical Composition", lmmunogenetics, 24: 71-78, 1986.